
 PrizmikAca
 PrizmikWeb
 PrizmikFunc
 PrizmikApi
 PrizmikSwa
 PrizmikSuite
 If you've ever managed Azure API Management, you know the feeling. A dozen browser tabs open. Clicking through a seemingly endless maze of blades just to update a single policy. It's a powerful service, but the portal can feel like you're navigating a labyrinth in the dark.
What if you could trade that chaos for clarity? What if you could manage your entire API landscape from a single, elegant command center on your desktop?
See Your Entire API World at a Glance
PrizmikApi isn't just another tool; it's a complete, native desktop workspace for APIM. Instead of juggling separate blades for APIs, products, policies, and subscriptions, you see them all in one unified interface. But it's more than just a list of resources — PrizmikApi helps you truly understand your API ecosystem.
With our interactive relationship graph, you can finally see how everything connects. It's a living map of your services, showing which products consume which APIs and which subscriptions have access. Click on any part of the map to instantly drill down into its configuration. For the first time, you can see the whole picture.
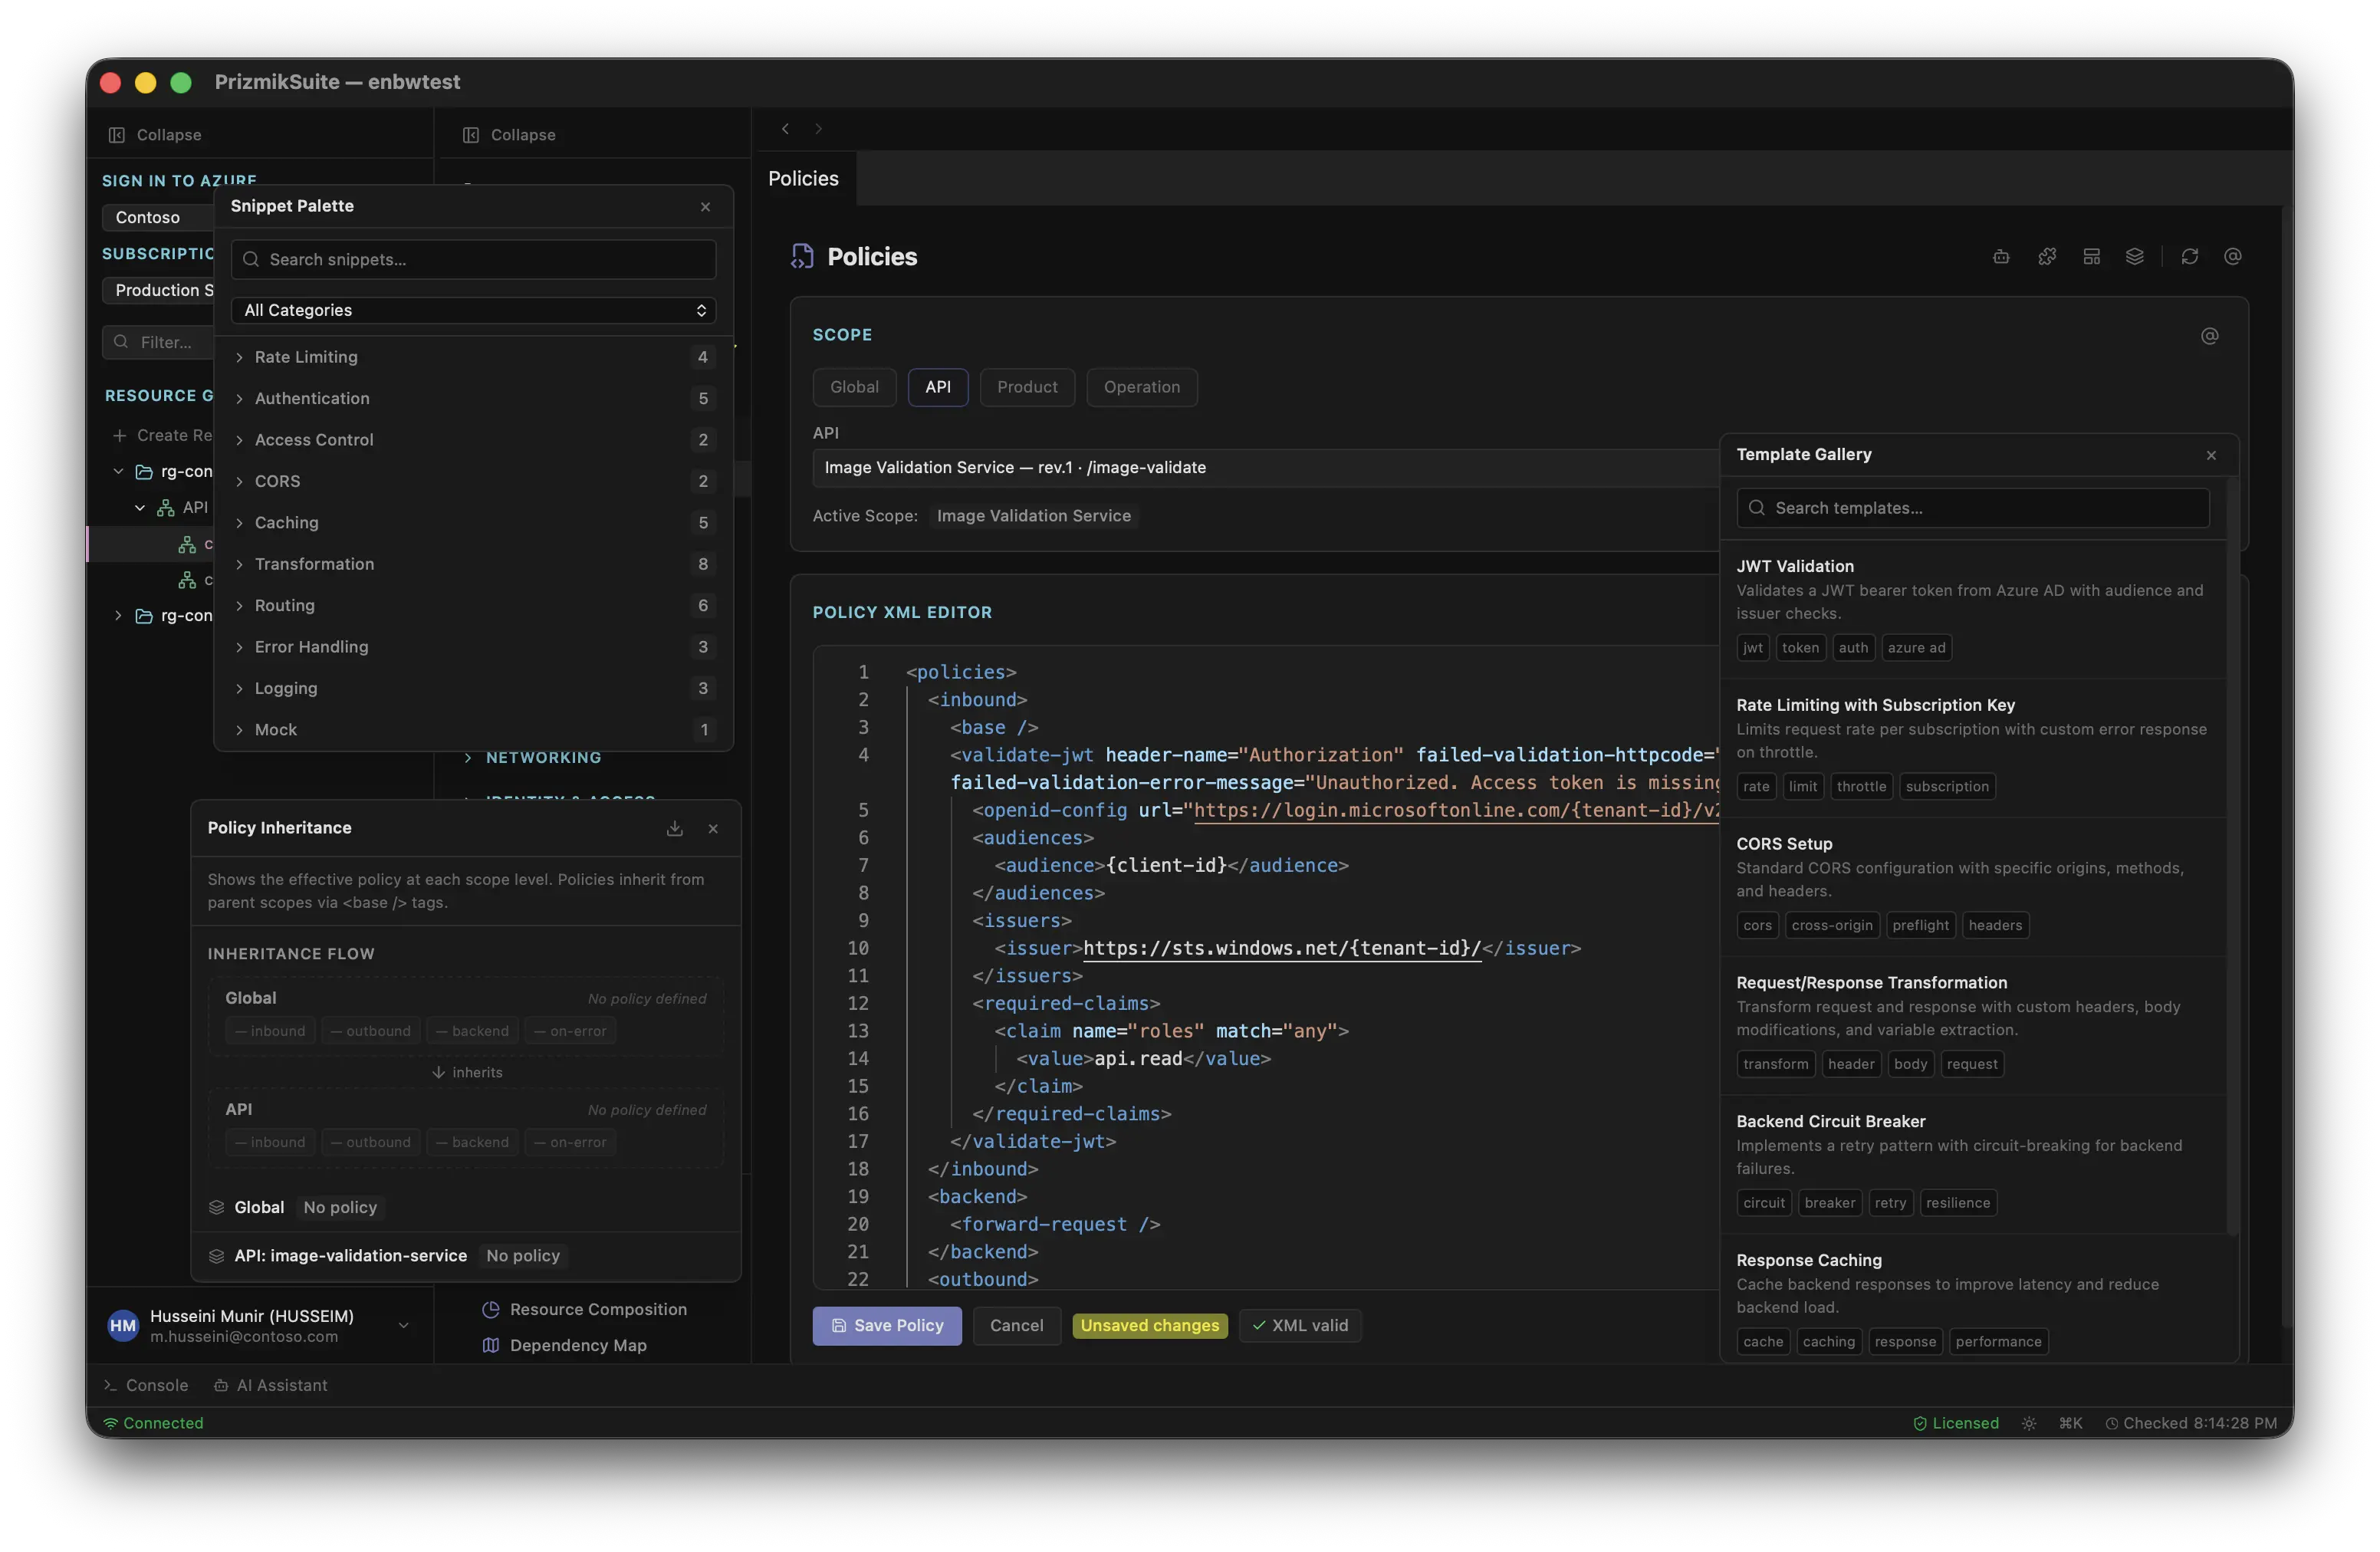
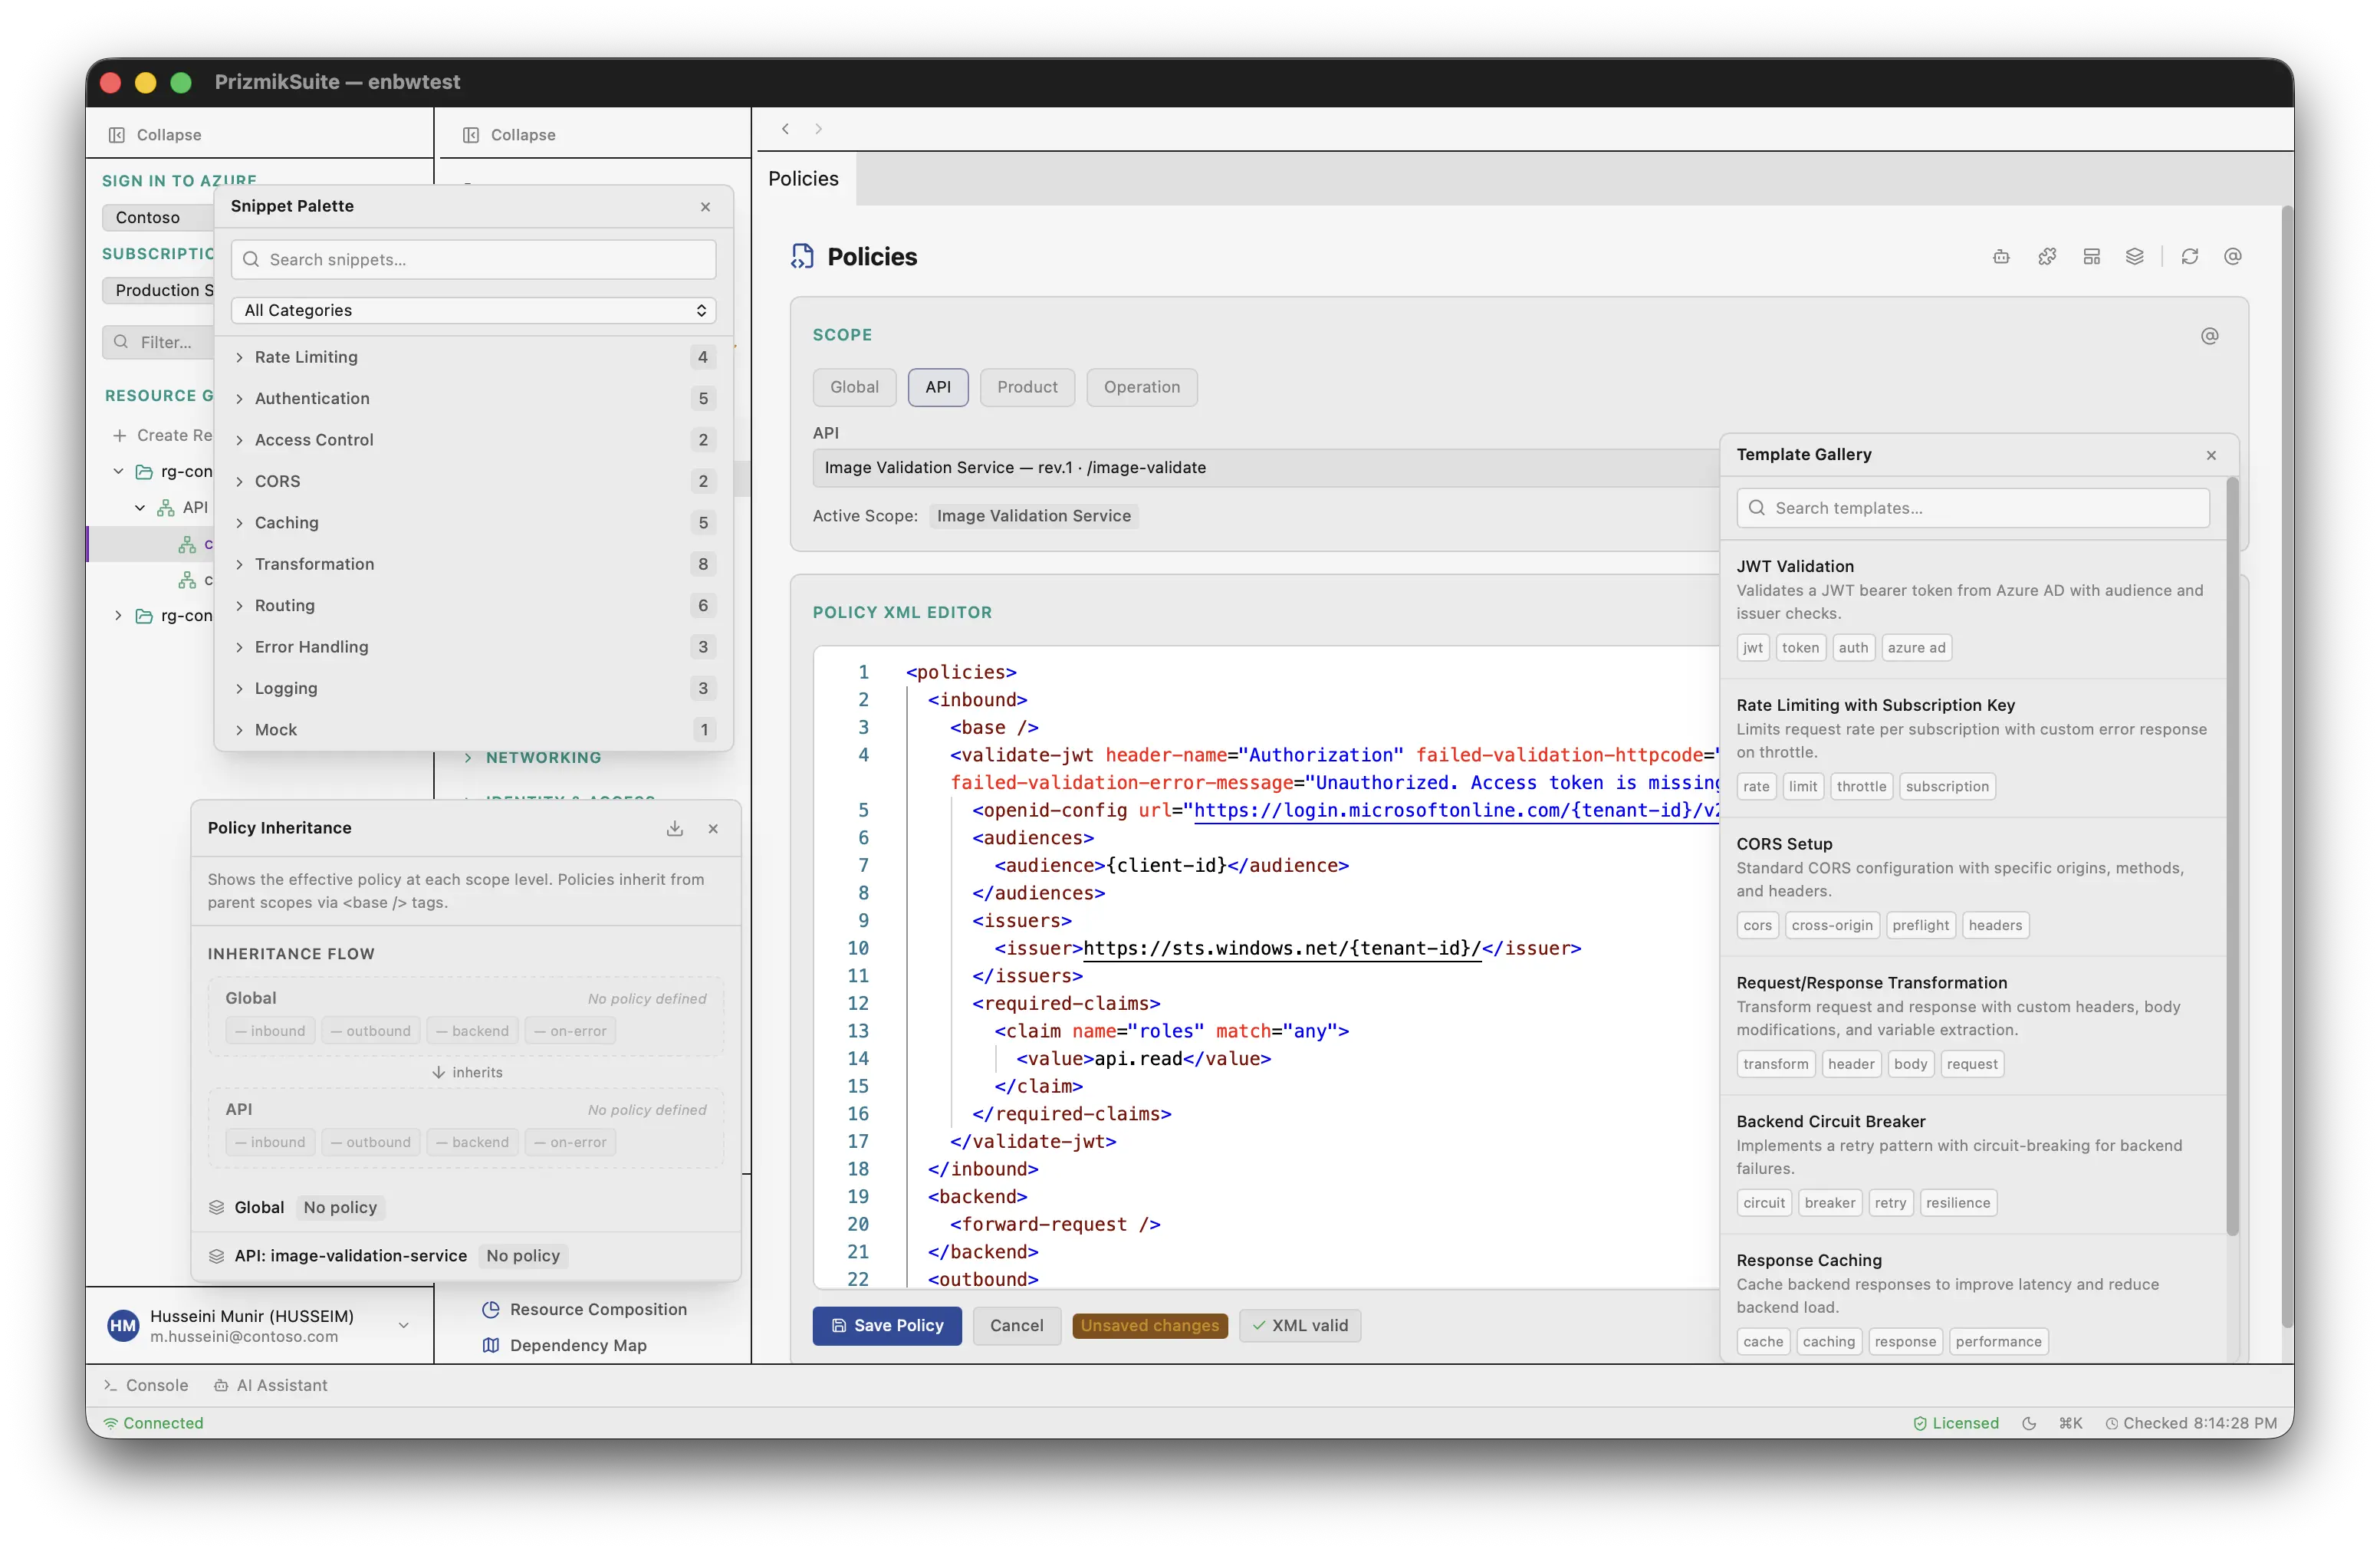
From Notepad to a Professional IDE for Policies
Let's be honest: editing complex XML policies in a tiny web form is a nightmare. It's the number one complaint we hear from APIM administrators. That's why we built a policy editor that developers will love.
Imagine a full-featured code editor with syntax highlighting, a palette of ready-to-use snippets, and a revolutionary side-by-side view. See the global, product, API, and operation-level policies all at once, and instantly understand how they cascade. It's the difference between writing in Notepad and working in a professional IDE.
Data That Tells a Story
Stop guessing about performance. Our purpose-built analytics dashboard transforms raw metrics into clear, actionable insights. See request volumes, error rates, and latency distributions in beautiful, easy-to-read charts. Understand your API traffic patterns instead of just collecting data points.
Even complex rules like rate limits become simple. PrizmikApi visualizes your policies, showing you exactly how many calls are remaining and when quotas reset, without you having to parse a single line of XML.
It's time to stop fighting the portal and start architecting your APIs. PrizmikApi gives you the power and clarity to do it right.