
 PrizmikAca
 PrizmikWeb
 PrizmikFunc
 PrizmikApi
 PrizmikSwa
 PrizmikSuite
 Imagine trying to understand a city by looking at a list of its street names. You'd see "Main Street," "Oak Avenue," and "Elm Drive," but you'd have no idea how they connect, where the highways are, or how to get from one side of town to the other. This is what it feels like to manage a complex Azure Functions application in the Azure Portal. You get a flat list of functions, but the architecture—the actual map of how everything is connected—is invisible.
As your serverless application grows, this isn't just inconvenient; it's a barrier to understanding. How can you debug a system you can't see? How can you onboard a new teammate to a project that has no blueprint?

The Blueprint You've Always Wanted
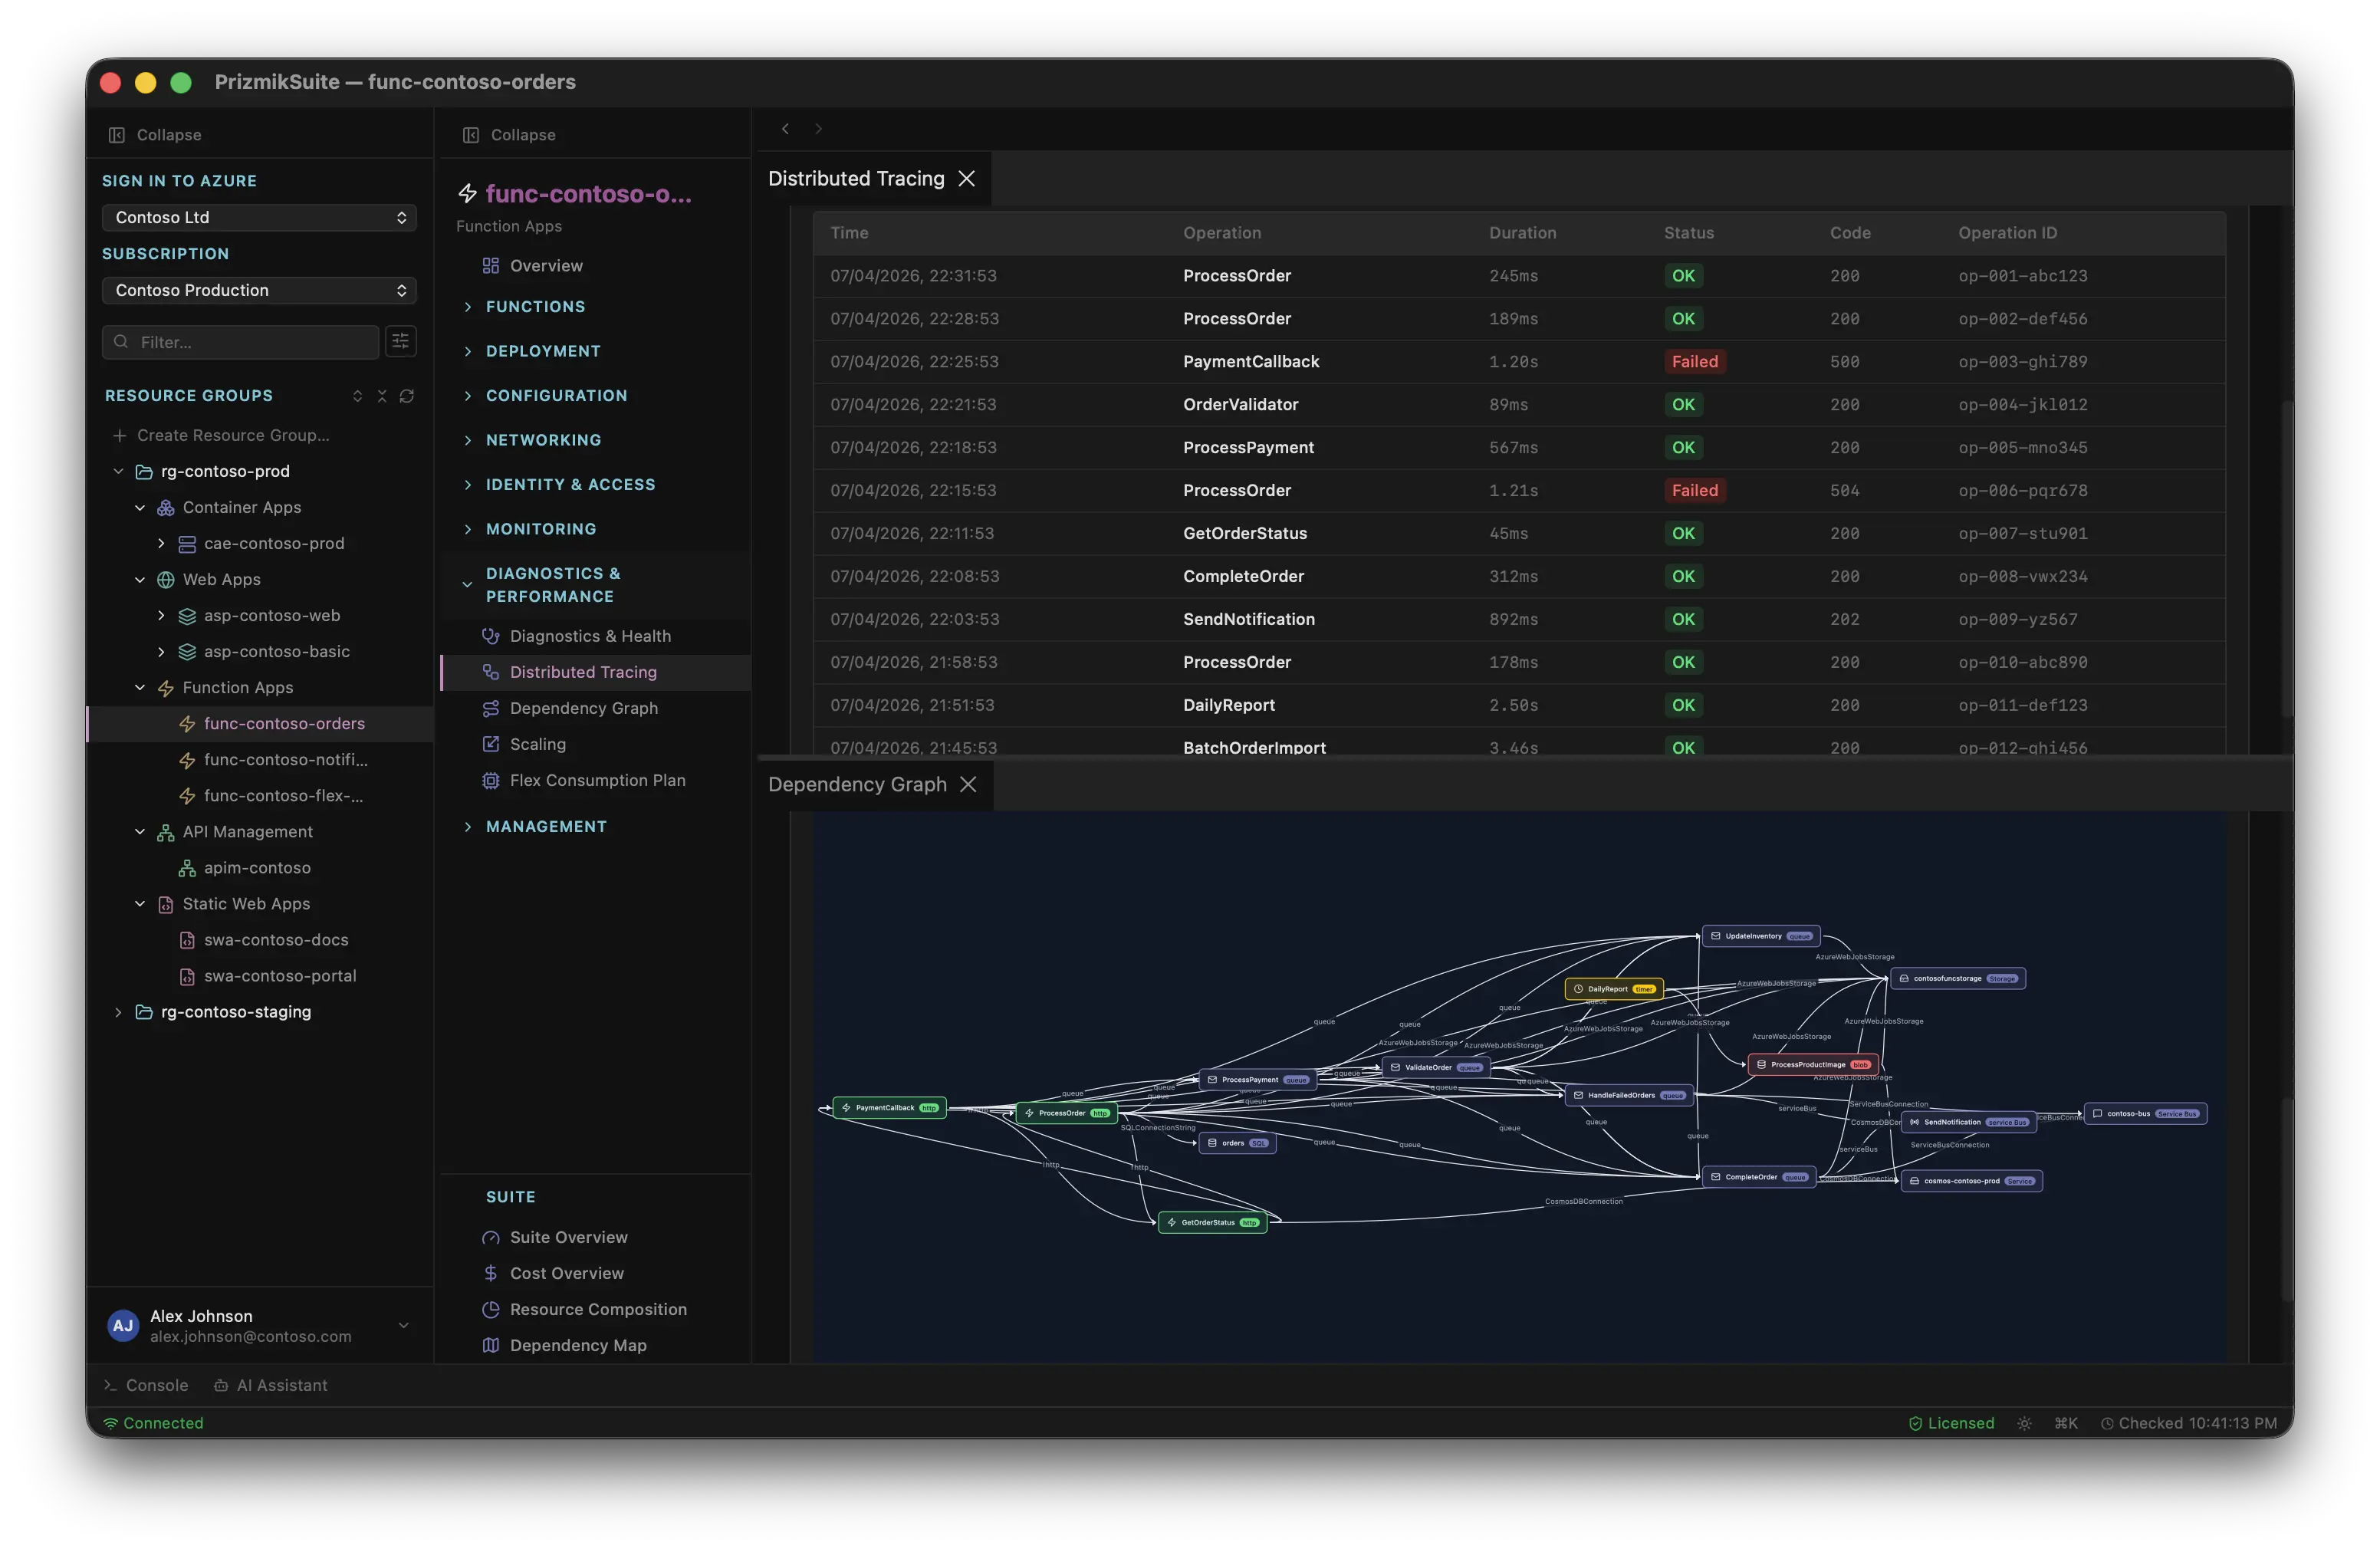
PrizmikFunc doesn't just give you a list; it gives you the map. Our Dependency Graph automatically generates an interactive, visual blueprint of your entire Function App. It's not a diagram you have to draw and keep updated manually. It's a living document, generated directly from your code, that shows you how everything is wired together.
In one simple view, you can see:
- Which HTTP trigger kicks off a long chain of events.
- Which functions are all listening to the same Service Bus queue.
- How data flows from a trigger, through a function, and out to a Cosmos DB collection.
Suddenly, the city has a map. The architecture is no longer an abstract concept in your head; it's a concrete diagram you can point to, discuss, and debug.
From Guesswork to Data-Driven Decisions
This isn't just a pretty picture. It's a powerful tool for making better engineering decisions. When a new developer joins the team, you don't have to spend hours explaining every function.json file. You can just show them the graph. When you're planning a major refactoring, the graph reveals which functions are dangerously coupled and which can be moved independently. It turns architectural guesswork into a data-driven process.
The Blueprint and the Live Action
The Dependency Graph is your system's blueprint—it shows how things are designed. But PrizmikFunc also gives you the live-action replay. Our Distributed Tracing view shows you how requests actually flow through your system at runtime. By combining the static blueprint with the dynamic trace, you get the complete story. You can see your architecture and watch it in motion, a combination that makes even the most complex bugs easier to find and fix.
You can't manage what you can't see. It's time to turn the lights on.